
Monitoring Service Bus with Azure Functions and Datadog
Thursday, October 6, 2016
Service Bus has recently been added to the new Azure Portal, but its metrics are not currently exposed to the portal so we cannot create charts and alerts for them yet.
Luckily, we can easily access the metrics using Service Bus' management REST API. Even easier still, we can use the Service Bus SDK to access information such as queue length. Today we'll look at how to use Azure Functions to get queue and subscription length metrics into the popular cloud monitoring tool Datadog.
Create a Function App
Go to the Azure Portal and create a new dynamic Function App.
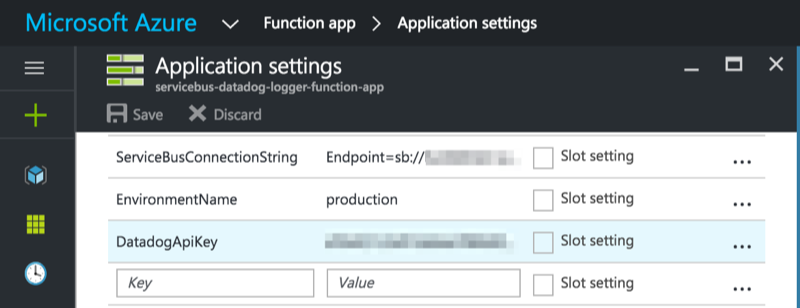
In the Function App's app settings, we'll add 3 values:
ServiceBusConnectionString - a connection string for the Service Bus namespace we want to monitorEnvironmentName - we'll use this to tag the metrics with a Datadog environment nameDatadogApiKey - an API key for our Datadog account
These settings will be available to our function as environment variables. We want all our secrets and settings that change based on environment to be stored here.
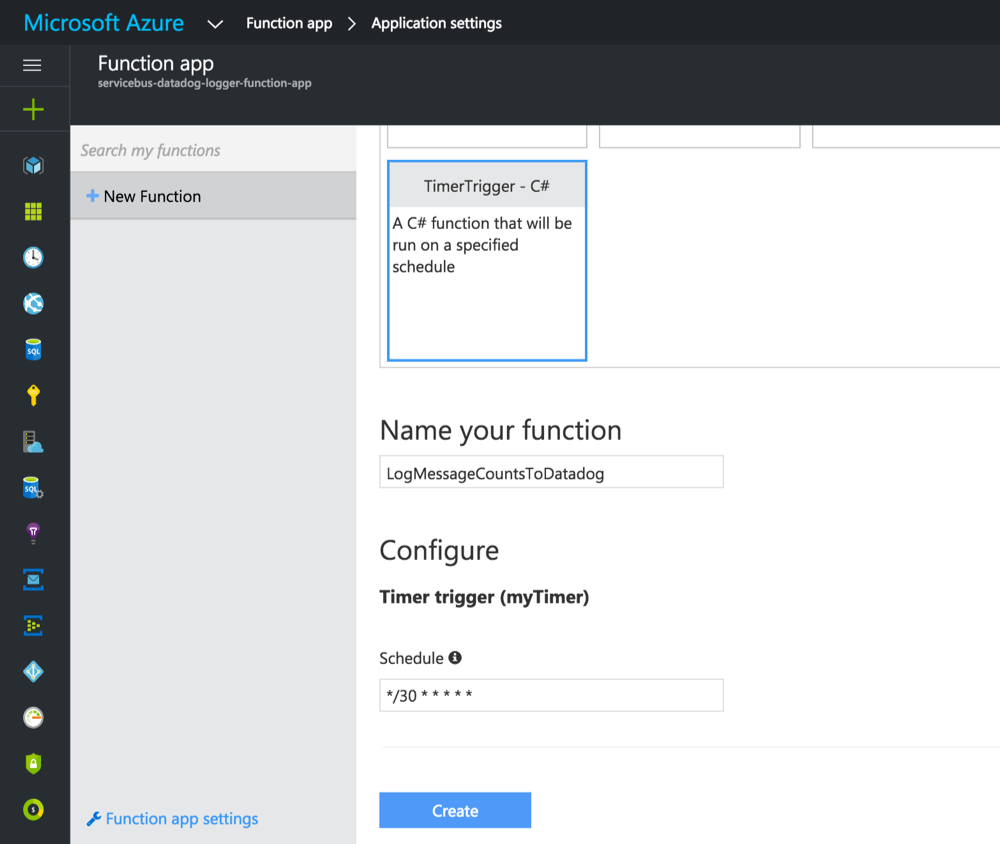
Create the function
Create a new function using the C# TimerTrigger function template. Enter a valid cron expression into the schedule box. For example, every 30 seconds would be */30 * * * * *.
To create the function without using the GUI, here's the function.json file:
{
  "bindings": [
    {
      "name": "myTimer",
      "type": "timerTrigger",
      "direction": "in",
      "schedule": "*/30 * * * * *"
    }
  ],
  "disabled": false
}
And here's the function body (run.csx):
#r "Microsoft.ServiceBus"

using System;
using Microsoft.ServiceBus;
using Microsoft.ServiceBus.Messaging;
using System.Text.RegularExpressions;
using System.Net.Http;
using static System.Environment;

static HttpClient httpClient = new HttpClient();
static string url = "https://app.datadoghq.com/api/v1/series?api_key="
    + Env("DatadogApiKey");

public static async Task Run(TimerInfo myTimer, TraceWriter log)
{
    var namespaceManager = NamespaceManager.CreateFromConnectionString(
        Env("ServiceBusConnectionString"));

    foreach(var topic in await namespaceManager.GetTopicsAsync())
    {
        foreach(var subscription in await namespaceManager.GetSubscriptionsAsync(topic.Path))
        {
            await LogMessageCountsAsync(
                $"{Escape(topic.Path)}.{Escape(subscription.Name)}",
                subscription.MessageCountDetails, log);
        }
    }

    foreach(var queue in await namespaceManager.GetQueuesAsync())
    {
        await LogMessageCountsAsync(Escape(queue.Path),
            queue.MessageCountDetails, log);
    }
}

private static async Task LogMessageCountsAsync(string entityName,
    MessageCountDetails details, TraceWriter log)
{
    var payload = new
    {
        series = new []
        {
            CreateMetric(entityName, "active_message_count",
                details.ActiveMessageCount),
            CreateMetric(entityName, "dead_letter_message_count",
                details.DeadLetterMessageCount)
        }
    };
    log.Info($"Posting: {entityName} {details.ActiveMessageCount} {details.DeadLetterMessageCount}");
    var result = await httpClient.PostAsJsonAsync(url, payload);
    log.Info(result.StatusCode.ToString());
}

private static object CreateMetric(string entityName, string metricName, long messageCount) => new
    {
        metric = $"servicebus.{entityName}.{metricName}",
        points = new [] { new [] {
            DateTimeOffset.UtcNow.ToUnixTimeSeconds(),
            messageCount
        } },
        type = "gauge",
        tags = new [] { "environment:" + Env("EnvironmentName") }
    };

private static string Escape(string input) => Regex.Replace(input, @"[^A-Za-z0-9]+", "_");

private static string Env(string name) => GetEnvironmentVariable(name, EnvironmentVariableTarget.Process);
The code is pretty straight-forward. Function Apps already include the Service Bus SDK. We can add a reference to it using #r "Microsoft.ServiceBus".
Then we're simply using the Service Bus client to iterate through all the queues and subscriptions in the namespace to get their MessageCountDetails and post them as metrics to Datadog using their REST API.
See metrics in Datadog
The function should be firing every 30 seconds. We can confirm this by checking its logs.
Now we can go into Datadog and use the Metric Explorer to find the metrics we sent in from the function:
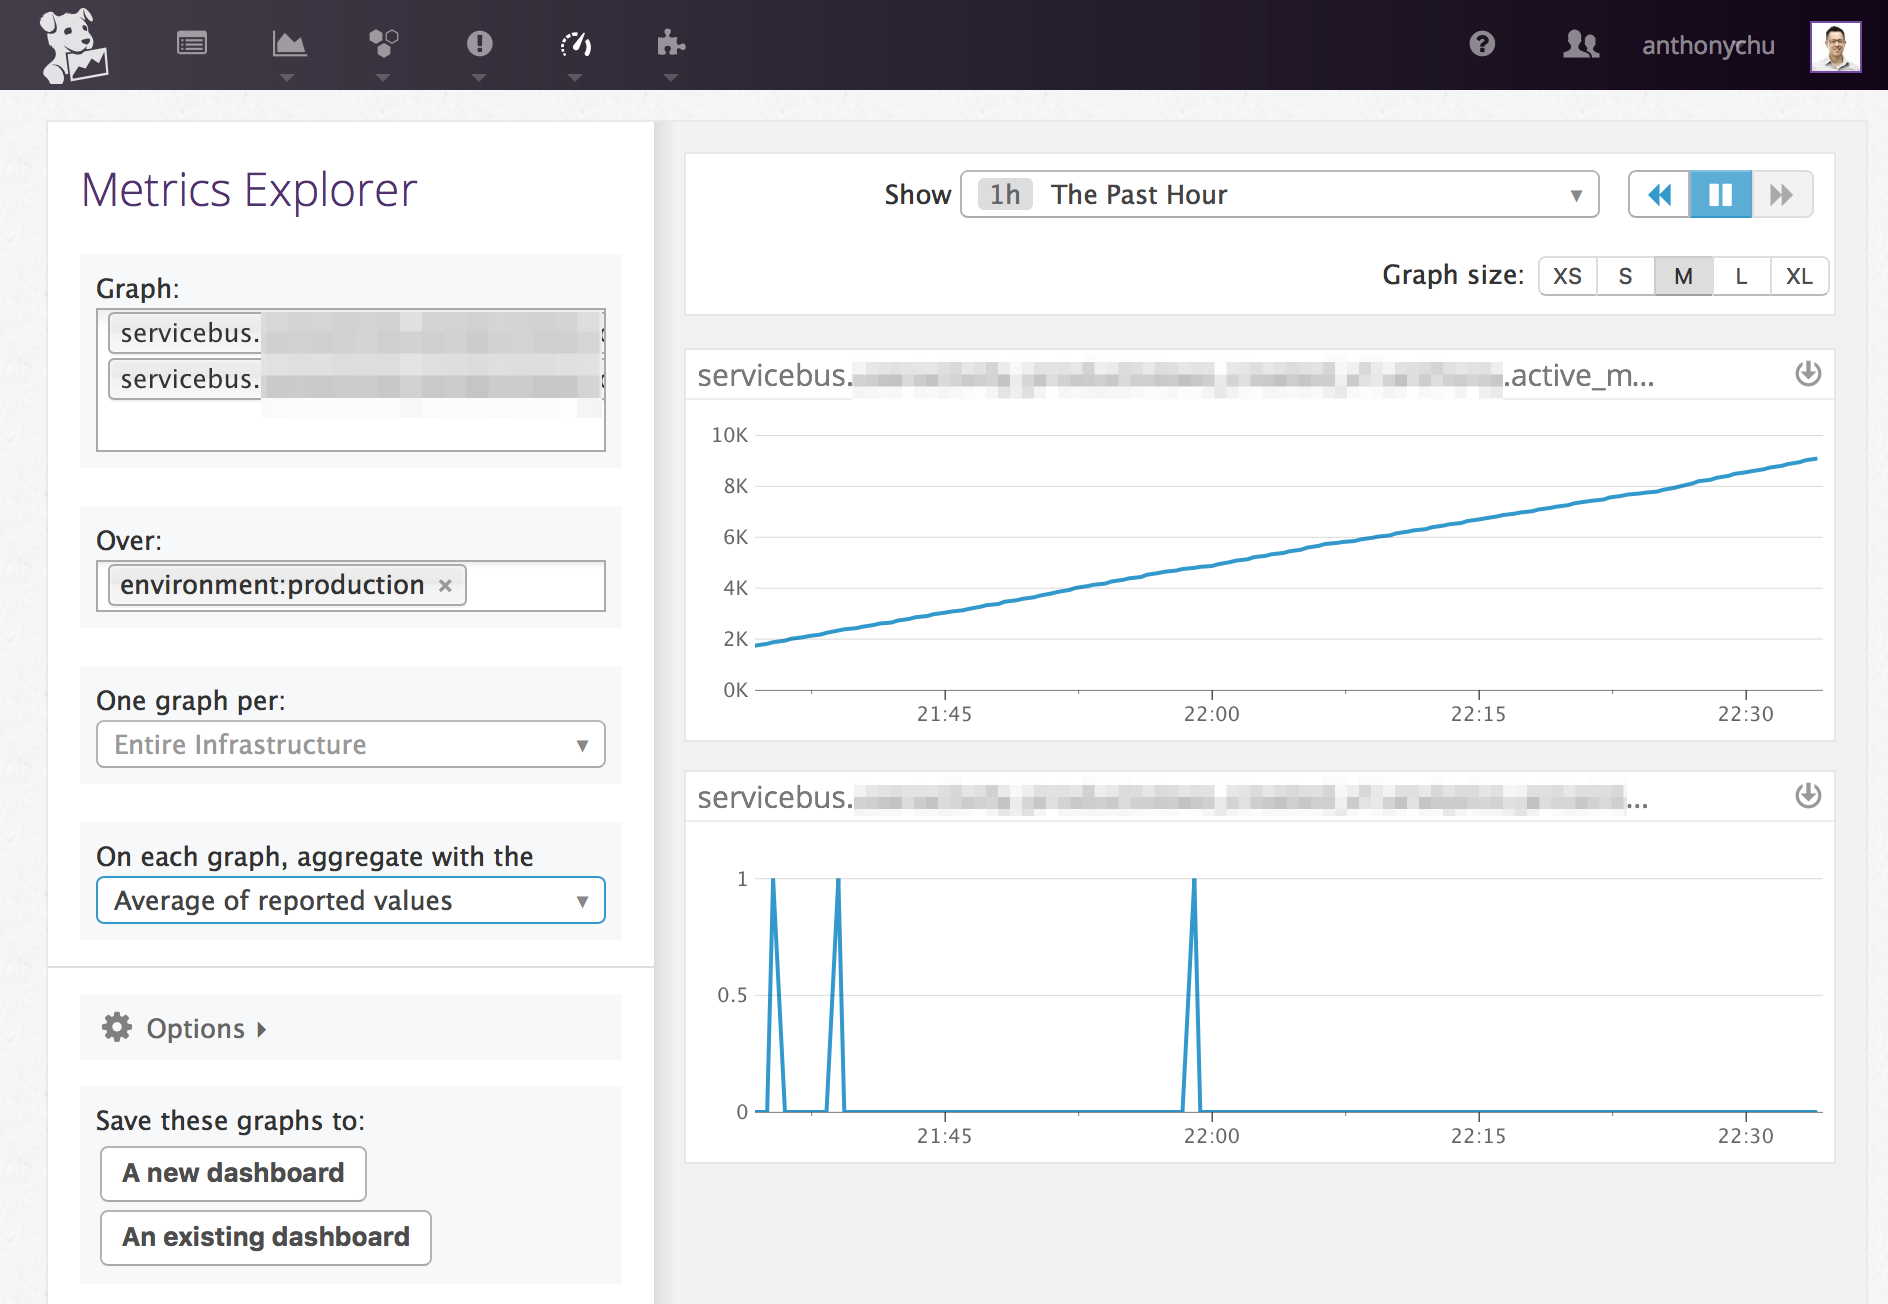
Here we can see the Service Bus subscription in the top graph has an increasing message count; whereas the one in the bottom graph is hovering around 0, meaning there's likely an application that is immediately consuming messages as they arrive.
We can now create dashboards in Datadog with these metrics and use them to trigger alerts if the go beyond a certain threshold.
Service Bus has recently been added to the new Azure Portal, but its metrics are not currently exposed to the portal so we cannot create charts and alerts for them yet.
Luckily, we can easily access the metrics using Service Bus' management REST API. Even easier still, we can use the Service Bus SDK to access information such as queue length. Today we'll look at how to use Azure Functions to get queue and subscription length metrics into the popular cloud monitoring tool Datadog.
Create a Function App
Go to the Azure Portal and create a new dynamic Function App.
In the Function App's app settings, we'll add 3 values:
ServiceBusConnectionString- a connection string for the Service Bus namespace we want to monitorEnvironmentName- we'll use this to tag the metrics with a Datadog environment nameDatadogApiKey- an API key for our Datadog account
These settings will be available to our function as environment variables. We want all our secrets and settings that change based on environment to be stored here.
Create the function
Create a new function using the C# TimerTrigger function template. Enter a valid cron expression into the schedule box. For example, every 30 seconds would be */30 * * * * *.
To create the function without using the GUI, here's the function.json file:
{
"bindings": [
{
"name": "myTimer",
"type": "timerTrigger",
"direction": "in",
"schedule": "*/30 * * * * *"
}
],
"disabled": false
}
And here's the function body (run.csx):
#r "Microsoft.ServiceBus"
using System;
using Microsoft.ServiceBus;
using Microsoft.ServiceBus.Messaging;
using System.Text.RegularExpressions;
using System.Net.Http;
using static System.Environment;
static HttpClient httpClient = new HttpClient();
static string url = "https://app.datadoghq.com/api/v1/series?api_key="
+ Env("DatadogApiKey");
public static async Task Run(TimerInfo myTimer, TraceWriter log)
{
var namespaceManager = NamespaceManager.CreateFromConnectionString(
Env("ServiceBusConnectionString"));
foreach(var topic in await namespaceManager.GetTopicsAsync())
{
foreach(var subscription in await namespaceManager.GetSubscriptionsAsync(topic.Path))
{
await LogMessageCountsAsync(
$"{Escape(topic.Path)}.{Escape(subscription.Name)}",
subscription.MessageCountDetails, log);
}
}
foreach(var queue in await namespaceManager.GetQueuesAsync())
{
await LogMessageCountsAsync(Escape(queue.Path),
queue.MessageCountDetails, log);
}
}
private static async Task LogMessageCountsAsync(string entityName,
MessageCountDetails details, TraceWriter log)
{
var payload = new
{
series = new []
{
CreateMetric(entityName, "active_message_count",
details.ActiveMessageCount),
CreateMetric(entityName, "dead_letter_message_count",
details.DeadLetterMessageCount)
}
};
log.Info($"Posting: {entityName} {details.ActiveMessageCount} {details.DeadLetterMessageCount}");
var result = await httpClient.PostAsJsonAsync(url, payload);
log.Info(result.StatusCode.ToString());
}
private static object CreateMetric(string entityName, string metricName, long messageCount) => new
{
metric = $"servicebus.{entityName}.{metricName}",
points = new [] { new [] {
DateTimeOffset.UtcNow.ToUnixTimeSeconds(),
messageCount
} },
type = "gauge",
tags = new [] { "environment:" + Env("EnvironmentName") }
};
private static string Escape(string input) => Regex.Replace(input, @"[^A-Za-z0-9]+", "_");
private static string Env(string name) => GetEnvironmentVariable(name, EnvironmentVariableTarget.Process);
The code is pretty straight-forward. Function Apps already include the Service Bus SDK. We can add a reference to it using #r "Microsoft.ServiceBus".
Then we're simply using the Service Bus client to iterate through all the queues and subscriptions in the namespace to get their MessageCountDetails and post them as metrics to Datadog using their REST API.
See metrics in Datadog
The function should be firing every 30 seconds. We can confirm this by checking its logs.
Now we can go into Datadog and use the Metric Explorer to find the metrics we sent in from the function:
Here we can see the Service Bus subscription in the top graph has an increasing message count; whereas the one in the bottom graph is hovering around 0, meaning there's likely an application that is immediately consuming messages as they arrive.
We can now create dashboards in Datadog with these metrics and use them to trigger alerts if the go beyond a certain threshold.